 BEAS AI ReportExecutive product briefing
Business narrative
Ask your data. Ship the answer.
Turn operational questions into trusted reports, shared widgets, and living management boards — without waiting on a technical project queue.
End-to-end path
From connected data to decision output
Preparation
Operational sources, approved datasets, business glossary, and example questions. This is how the assistant learns your company.
Outcomes
Live reports, management boards, anomaly alerts, and scheduled email digests — the language of decision meetings.
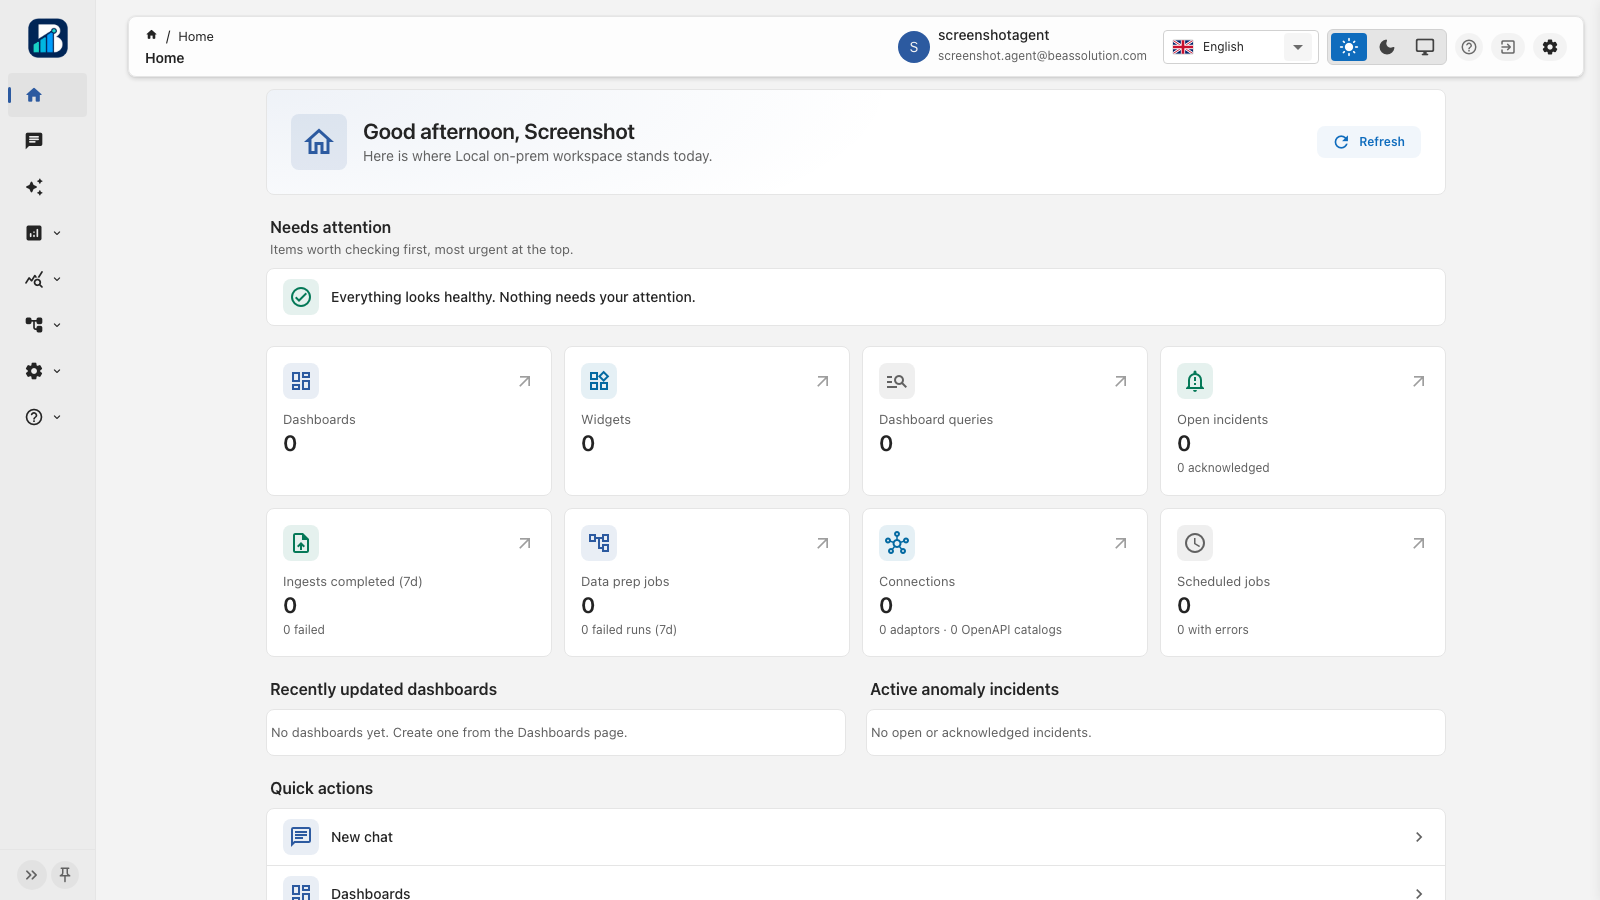
Home: attention items and metrics for the team at a glance.
Operational sources
Make living systems askable
Connect tables and collections from systems that run orders, subscriptions, inventory, or billing. After discovery, relationships are described in business language and Report can query live.
Example question
“What share of Istanbul-region orders were late in the last 30 days? Break it down by channel.”
Outcome: The same definition, answered in the ops meeting — no ticket wait.
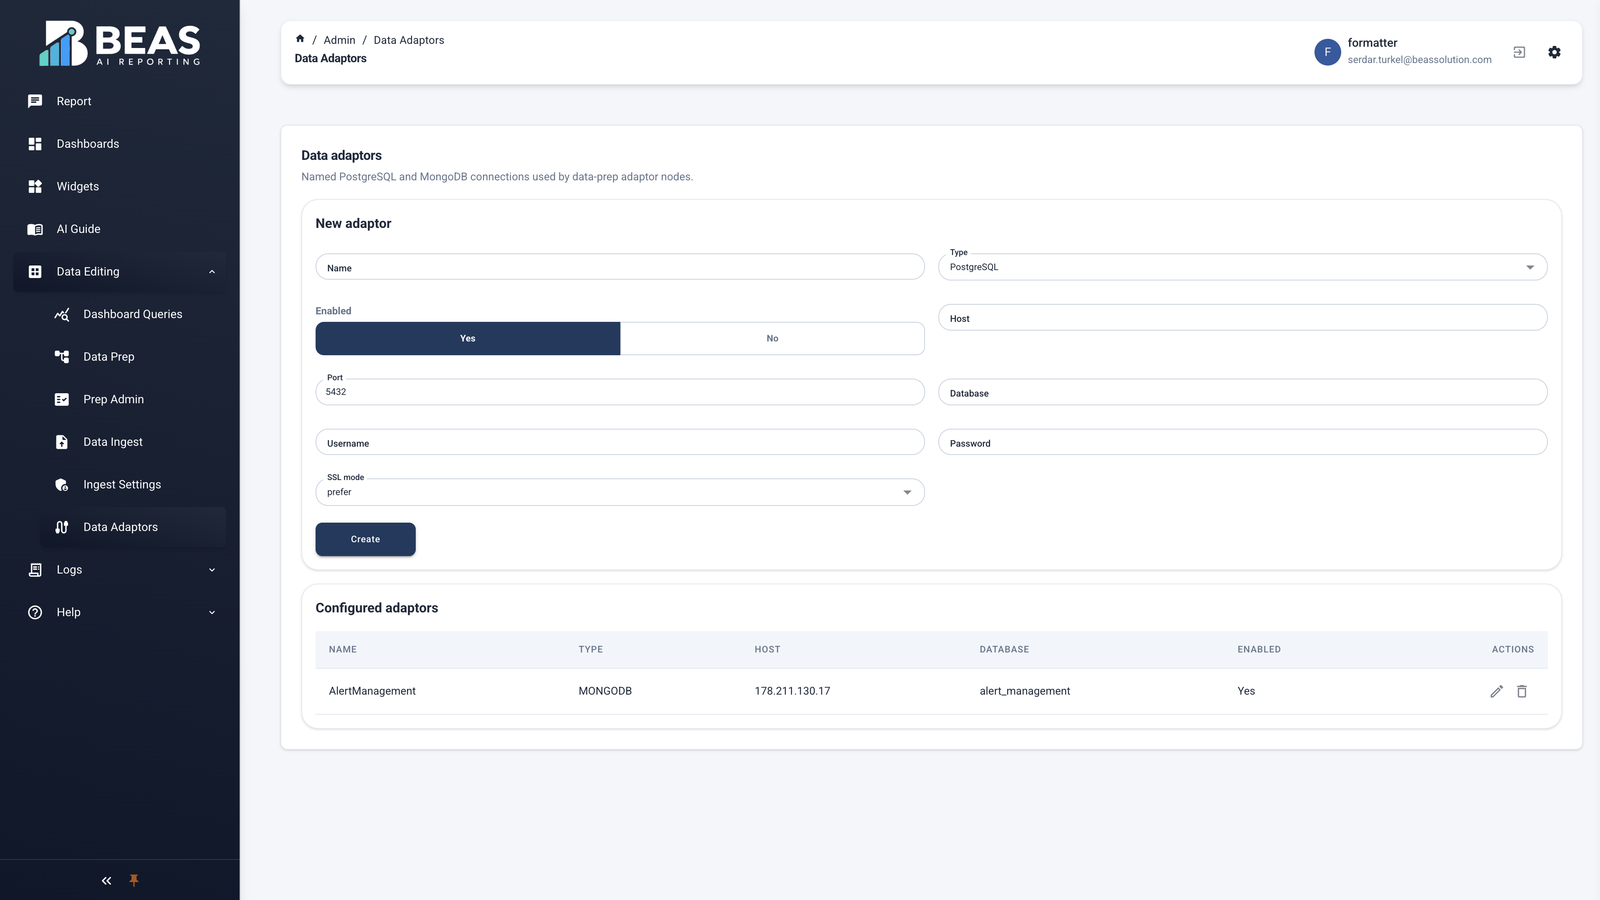
Data connectors: open business systems to reporting.
Trusted datasets
Keep report data approved and clean
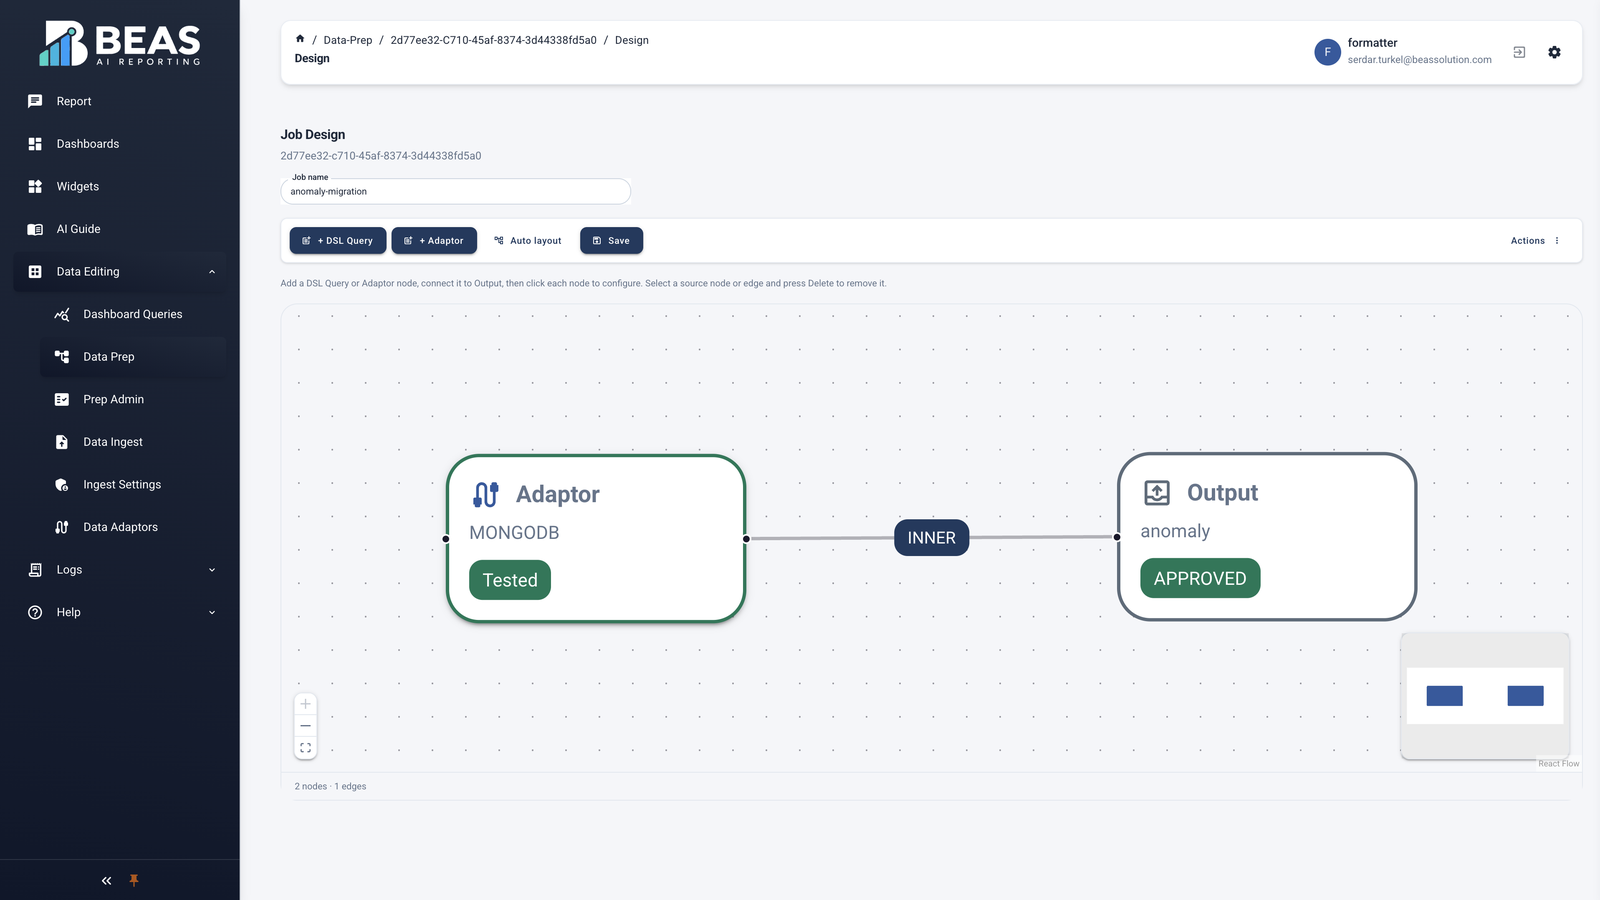
Data prep: source → output → approval → publish.
When building report sets from raw files or combined sources, approval steps and privacy rules apply. The published set becomes the trusted data the team asks against.
- DefineOne source set for the weekly sales summary
- ApproveThe business owner reviews and publishes the set
- ConsumeReport and boards query only the published set
Outcome: “Which Excel is correct?” debates end.
Conversational analytics
Ask in meeting language — get the answer in the same thread
Leaders and analysts write the question they already ask. The answer returns as text, table, chart, or KPI summary. Forecast views require explicit confirmation when needed.
Sample dialogue
“How did gross margin change by product family in Q3? Show the three families that declined most.”
The assistant returns a table plus a short commentary. The user asks to see it as a chart — visualization appears in the same conversation.
Outcome: No ad-hoc report ticket queue.
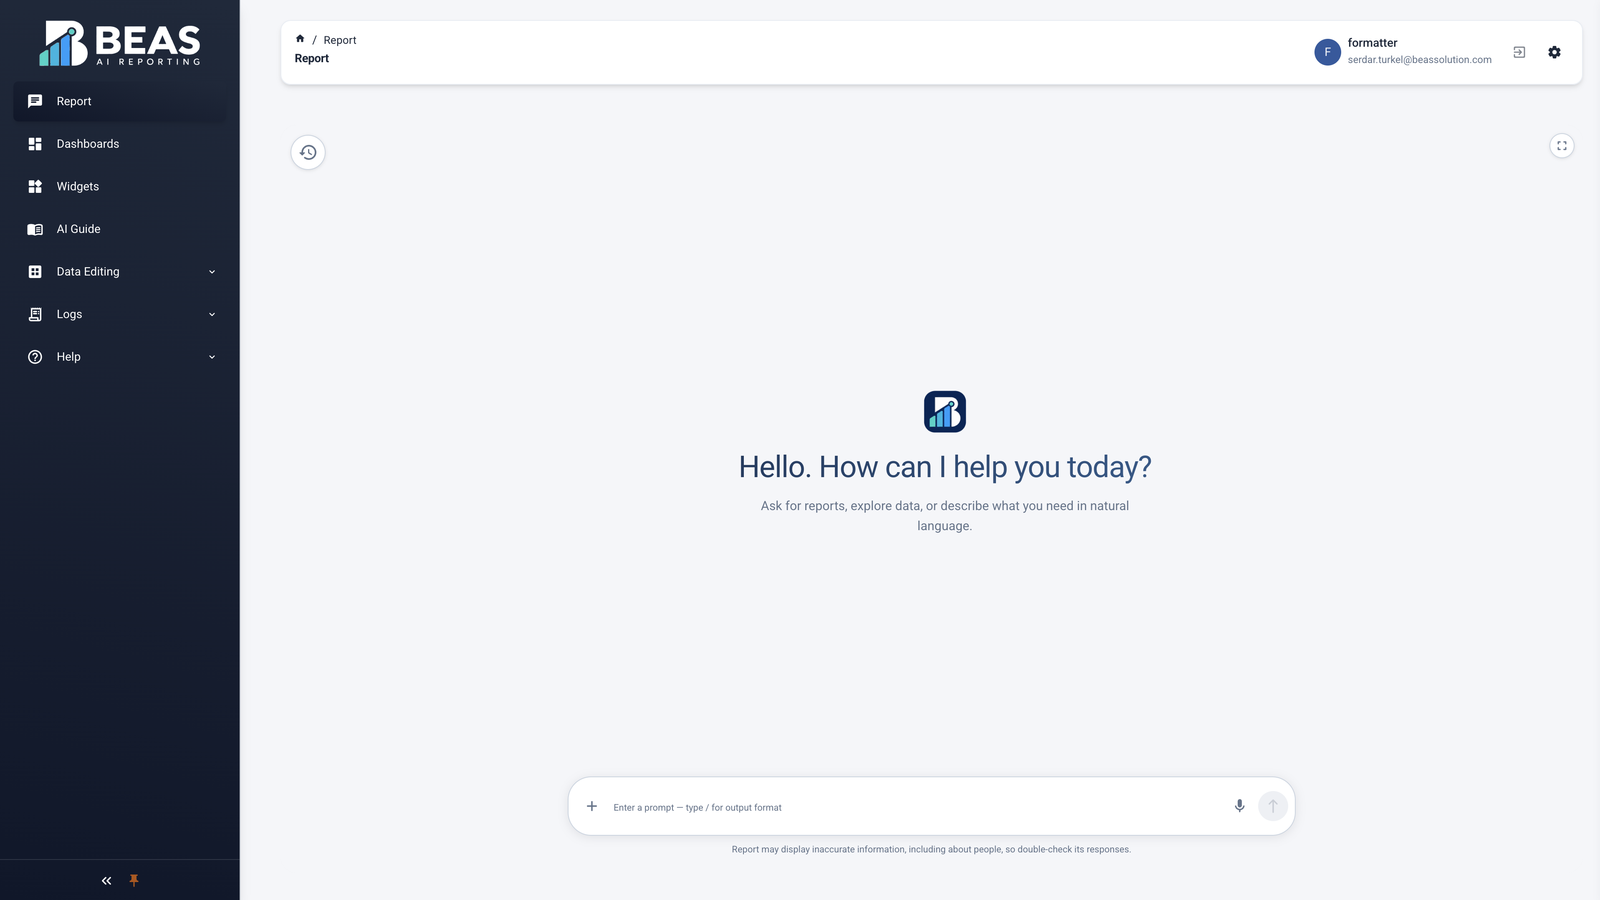
AI Report: question, history, and output formats on one surface.
Company lexicon
Teach the assistant your language
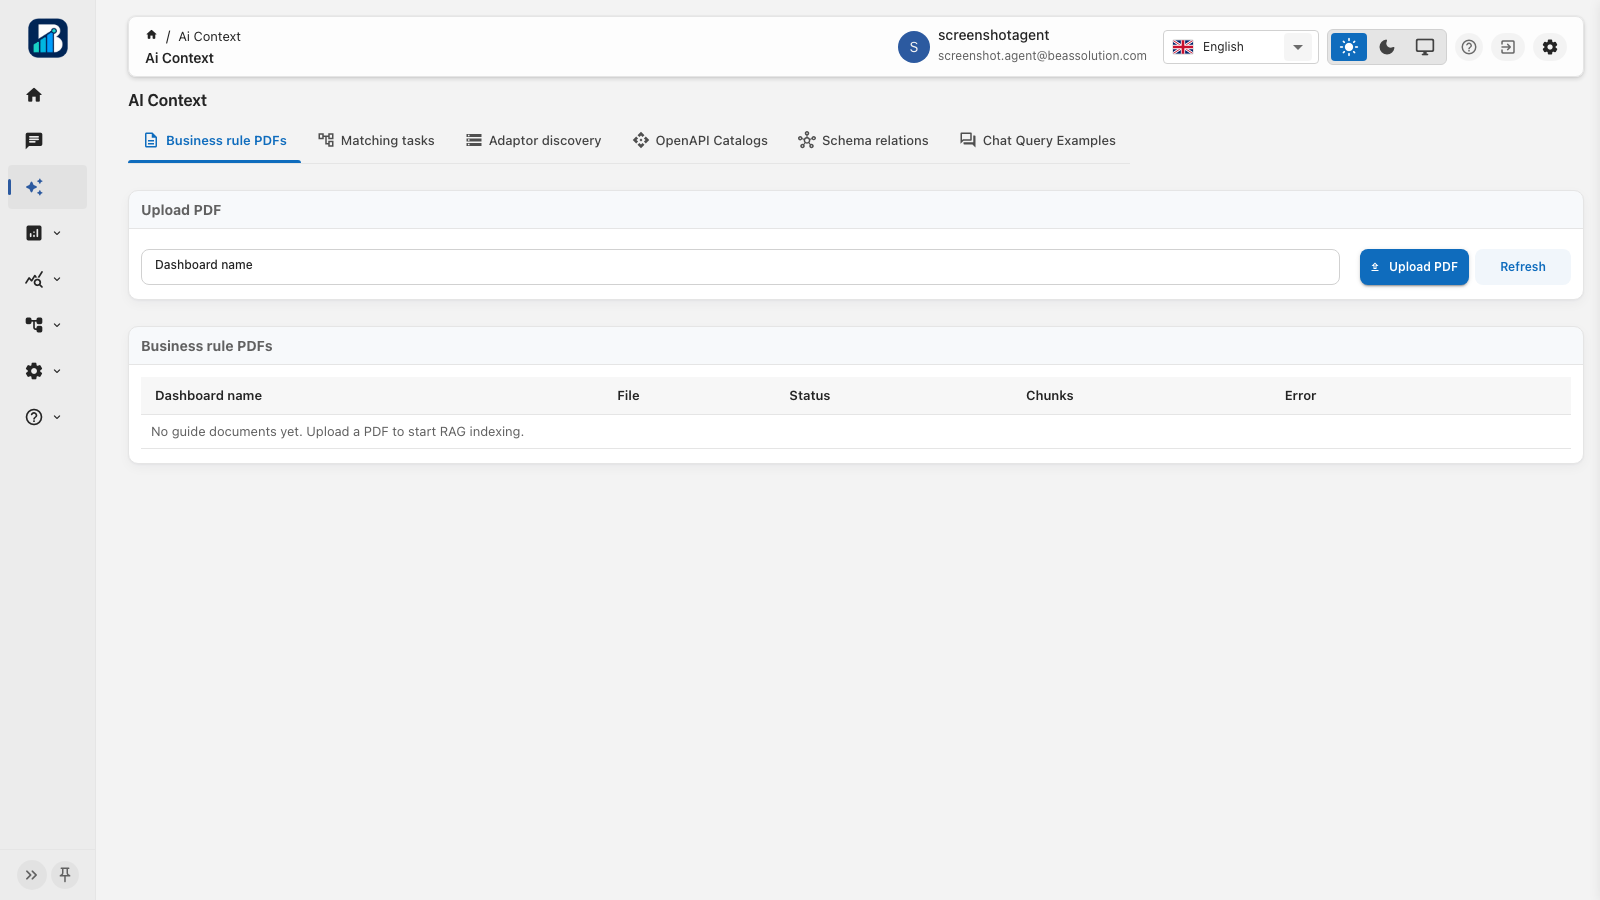
AI Context: policies, data meaning, relationships, examples.
Approved policy documents, definitions such as “what is an active subscriber?”, how tables join, and successful question examples become the assistant’s preferred source — your glossary over guesswork.
Example business rule
“Cancellation” means only orders closed by customer request; system timeout cancellations are a separate KPI. Once written into context, every report speaks the same language.
Outcome: Answers stay aligned with your status codes and KPI definitions.
Reusable measures
Turn a correct answer into a lasting metric
When a chart or table is right, save it as a widget. The same metric definition is shared across boards — “revenue” is the same number everywhere.
Example
“Net new subscribers (month)” is defined once. Sales boards, finance boards, and executive emails all use that definition.
Outcome: A single source of truth.
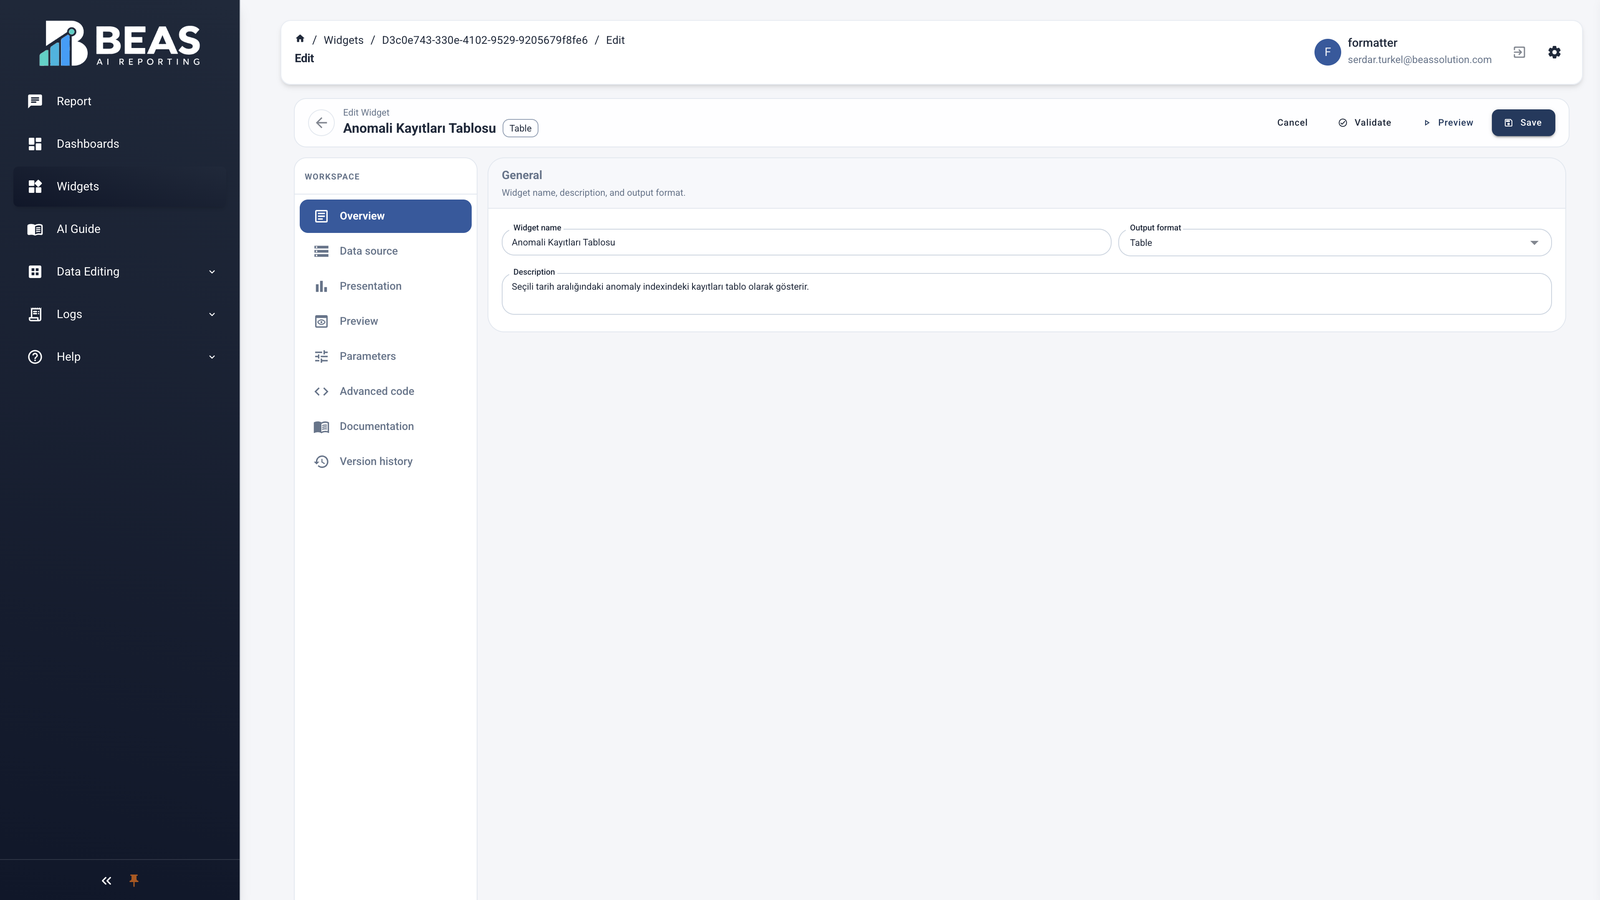
Widget studio: promote an answer into a reusable asset.
Living management views
Replace static slides with an operations board
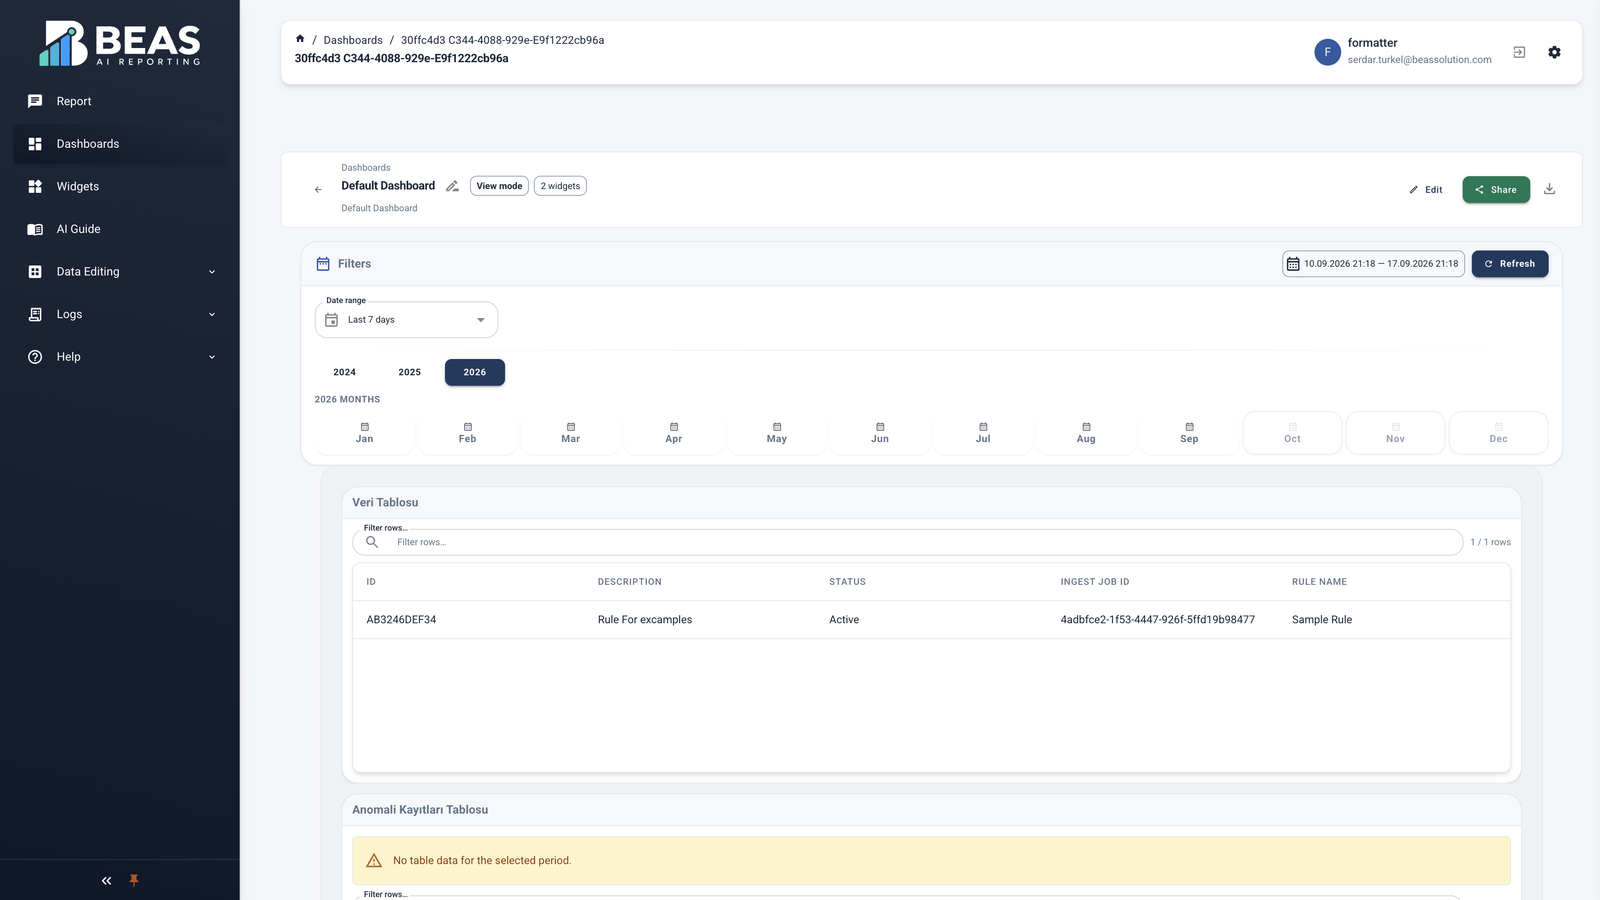
Dashboard: shared date range, filters, drill-down, export.
Assemble widgets on a board. Shared date filters, click-to-filter, drill-down, PDF/Excel export, and view-only share links keep stakeholders current.
Example board set
Weekly trading review: revenue, margin, late orders, NPS, open anomaly count — one date range.
Outcome: A living management board instead of a slide cycle.
Early signals
See unusual movement early
Define monitoring on key metrics. Inspect open events and explain what changed with Report. Operational changes remain subject to human approval.
Example
When daily return rate crosses a threshold, an event opens. An analyst asks Report “which product family drove it?”; root cause lands on the board and in the weekly digest.
Outcome: Early awareness without a separate monitoring island.
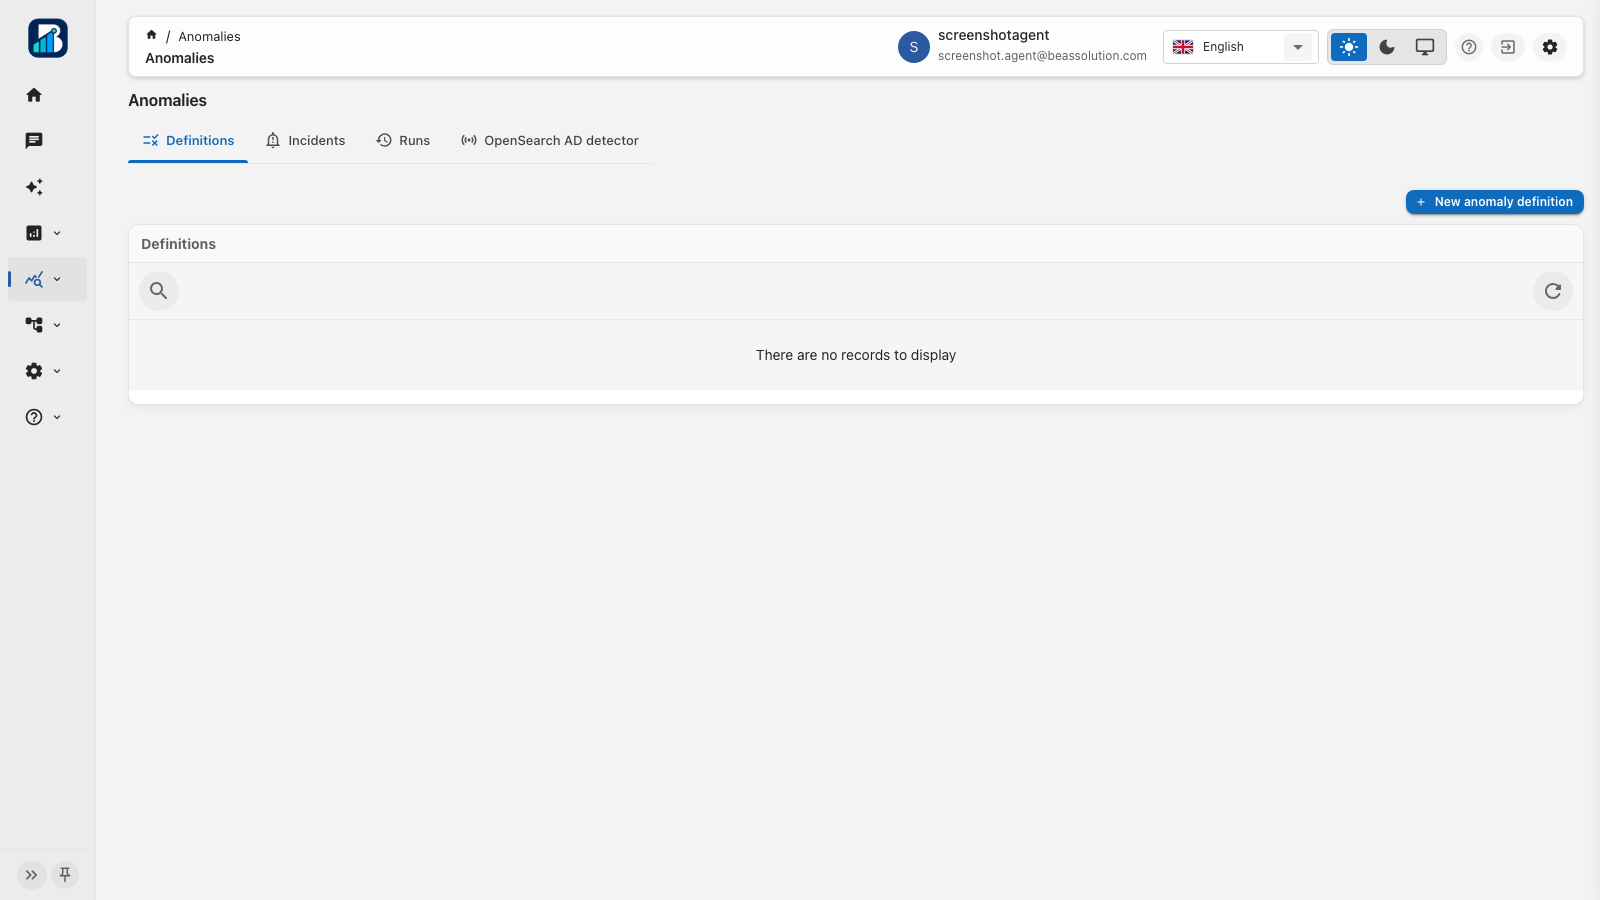
Anomalies: definitions, sync, and events on your business metrics.
Leadership cadence
Automate the tempo management expects
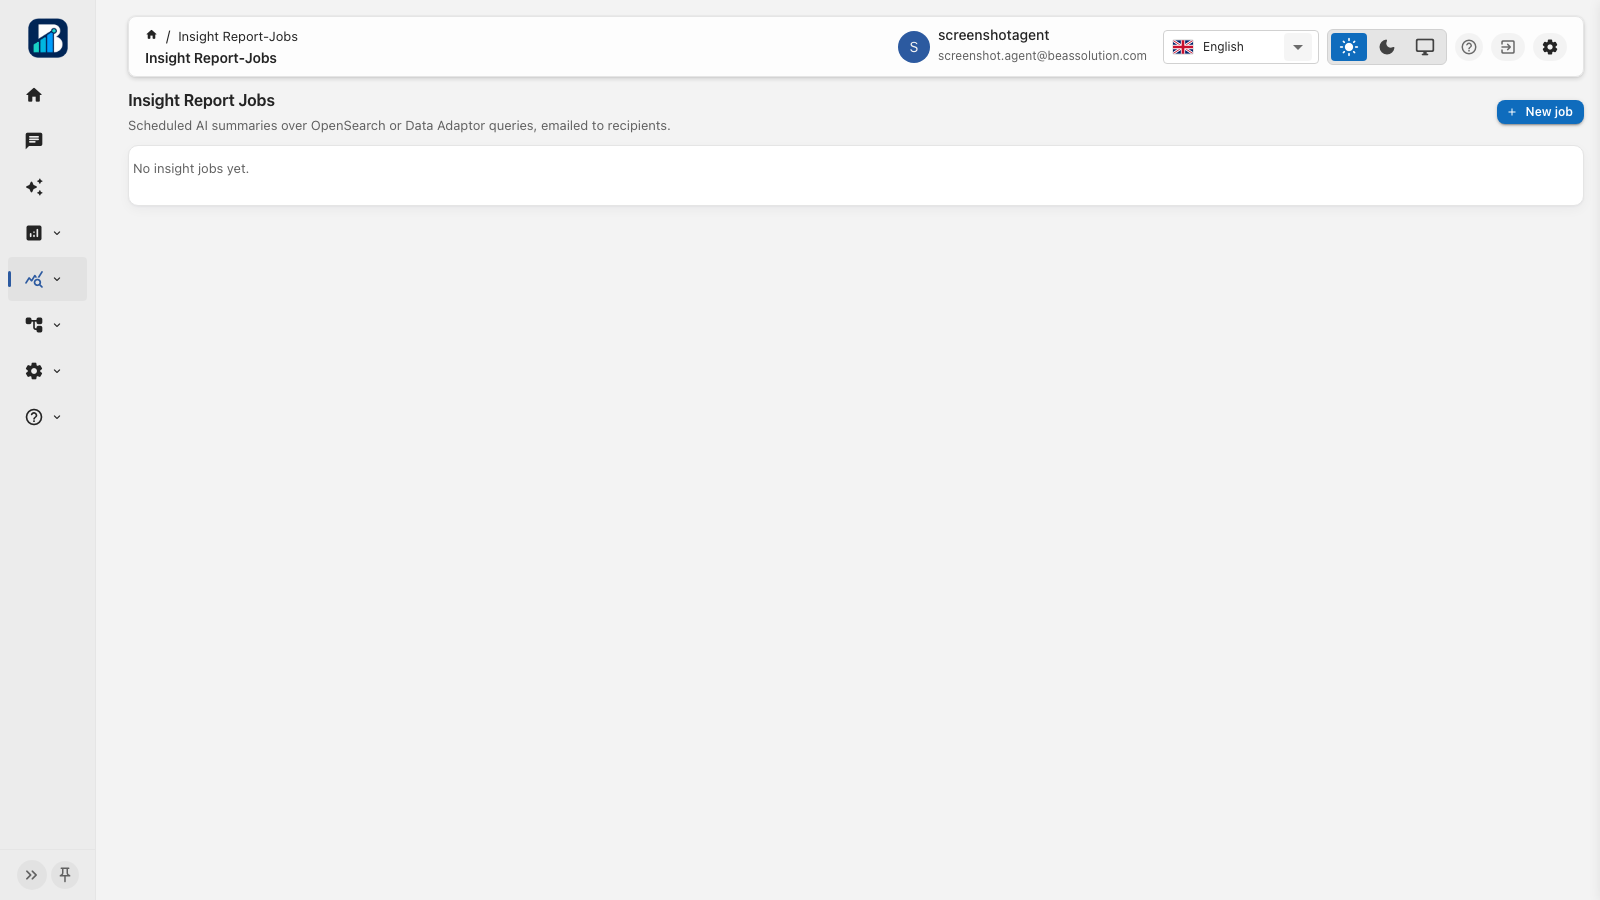
Insight Jobs: periodic summary → AI commentary → email.
Define recurring reports once — weekly KPIs, risk summaries, channel performance. When due, a digest is produced and delivered to the right inboxes without rebuilding every time.
Example schedule
Every Monday 08:30 — “Executive weekly brief” (revenue, margin, open anomalies, late orders).
Outcome: Proactive reporting aligned to leadership cadence.